

Autism Spectrum Disorder - Highlights from the Canadian Survey on Disability
Q&As
“Autism Spectrum Disorder: Highlights from the Canadian Survey on Disability”
Public Health Agency of Canada
The Public Health Agency of Canada has prepared Q&As to assist with the interpretation of some of the key statistics within the infographic “Autism Spectrum Disorder: Highlights from the Canadian Survey on Disability”. For additional information on the data source, please consult Statistics Canada’s website at 2017 Canadian Survey on Disability (CSD).
Q: Can the statistics within this infographic be compared to other sources of ASD information?
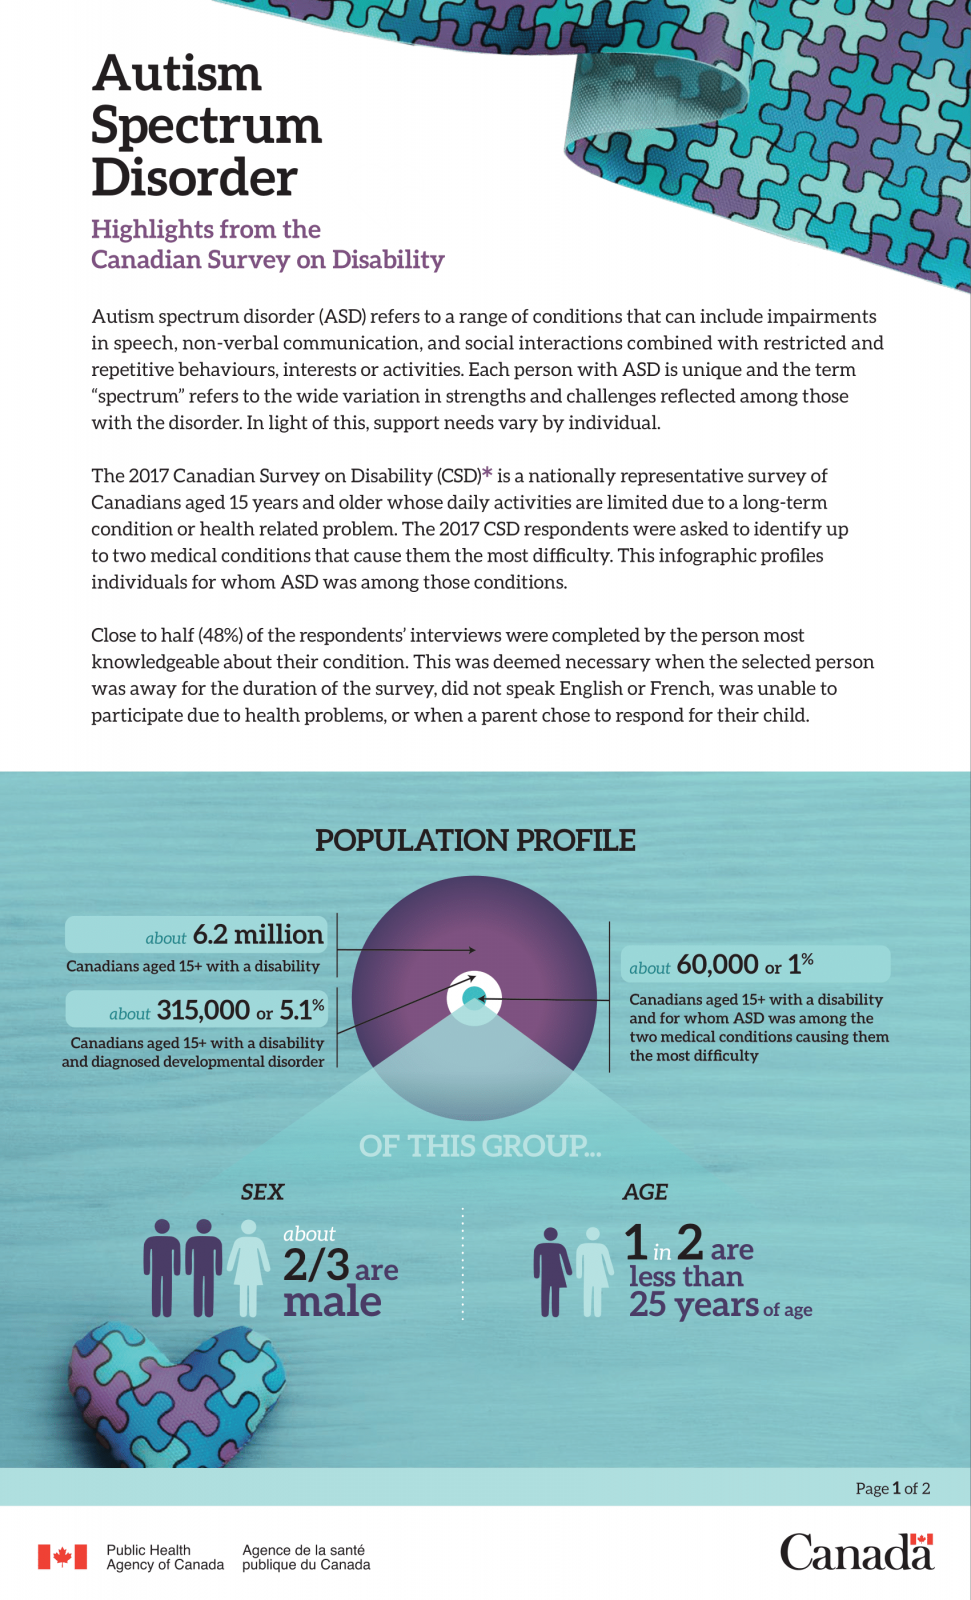
A: Comparing statistics within this infographic to other sources of ASD information such as the National ASD Surveillance System (NASS) is not recommended. Like every other data source used to produce surveillance information, the population covered by the 2017 CSD has some unique features that limit its potential for comparisons. The 2017 CSD covers Canadians aged 15 years and older living in private dwellings from all Provinces and Territories with a disability, and for whom ASD was identified among the two main medical conditions causing them the most difficulty. Whereas the NASS for instance, covers children between 5 and 17 years of age living in one of the seven participating Provinces and Territories and attending school.
Q: Why was a different data source used to compare the general and mental health status of the ASD population profiled in this infographic?
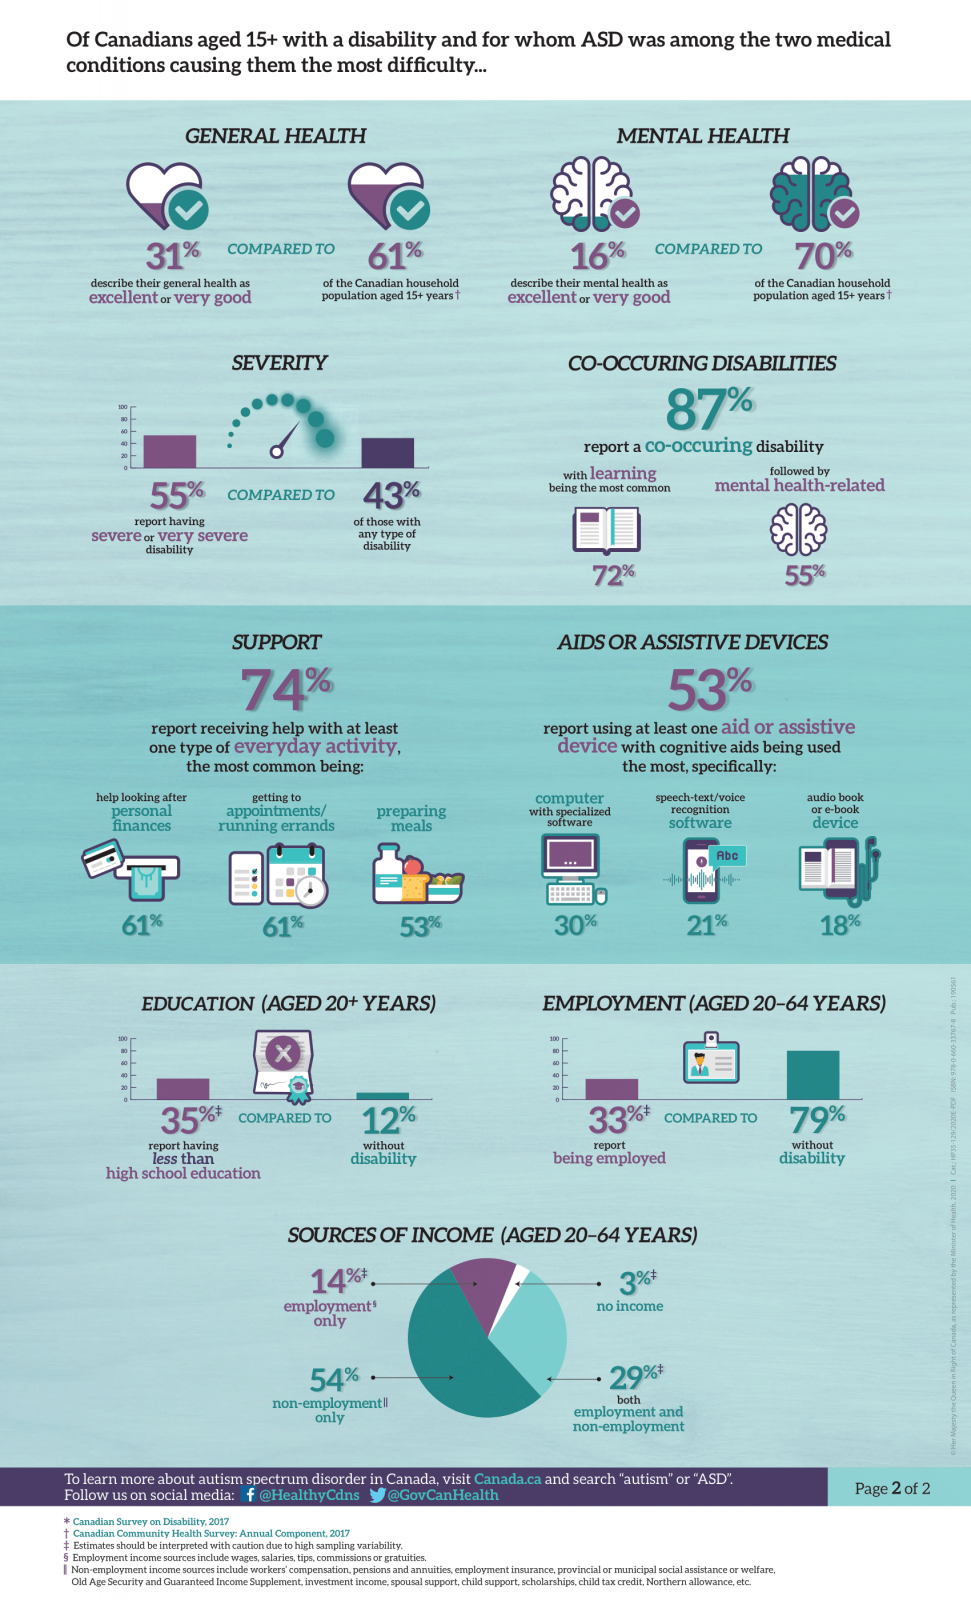
A: Information regarding the general and mental health status was not available for those without disability in the 2017 CSD. However, it was considered important to provide context for these two statistics; therefore, the 2017 Canadian Community Health Survey (CCHS) – Annual Component was used for comparison purposes. The 2017 CCHS – Annual Component offers a relevant comparator given that it covers the general Canadian household population and can be restricted to those aged 15 years and older.
Q: How were co-occurring disabilities and severity of disability measured in the 2017 CSD?
A: The first component of the 2017 CSD, the Disability Screening Questions, includes a set of questions that identify 10 distinct disability types: seeing, hearing, mobility, flexibility, dexterity, pain, learning, developmental, mental health and memory. In addition, it allows for the estimation of severity for each disability type, as well as an overall severity score.
The co-occurring disabilities statistic included in this infographic highlights the proportion of the ASD population with more than one of the above-mentioned disability types.
The severity statistics reflect the overall severity of disability. Four severity categories (mild, moderate, severe and very severe) were established. These categories take into account the intensity of the difficulties (no difficulty, some difficulty, a lot of difficulty, or cannot do) and the frequency (never, rarely, sometimes, often, or always) of activity limitations associated with each of the disability types a respondent may have.